Health Dashboard & Activity Log
Health Dashboard
Open the Health Dashboard (Cmd+D) to see:
- Service status and alerts
- Host disk and memory usage
- Docker runtime allocation (Docker Desktop or OrbStack)
- Per-container CPU and memory usage
- Config drift (running containers vs desired settings)
- SSL certificate warnings
- Container restart loops
- Docker disk usage with a one-click prune option
- PHP version mismatch diagnostics (configured site runtime vs
composer.jsonrequire.php), with a recommended runtime and nginx/PHP context
Use it as your “single pane of glass” for local dev health.
PHP version mismatch
When a site's configured PHP runtime no longer satisfies its composer.json require.php constraint, Canopy surfaces a PHP Version Mismatch issue with the recommended runtime and the relevant nginx/PHP context so you can switch the site to a compatible version.
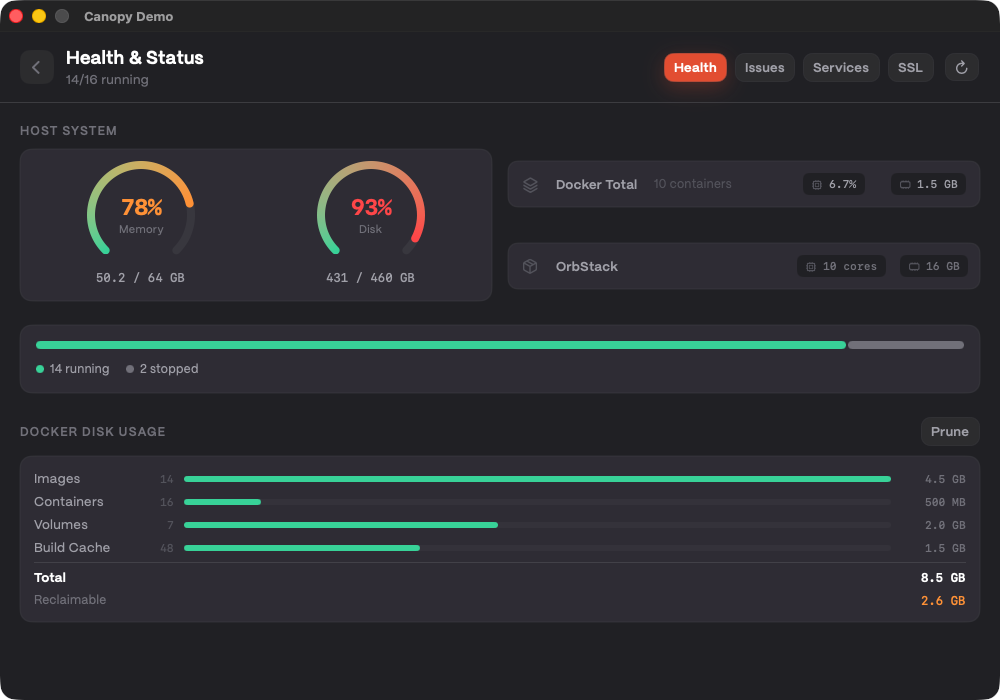 Temporary verification: Health Dashboard overview with status/resource gauges.
Activity Log
Open the Activity Log (Cmd+Opt+L) to review a chronological feed of:
- Site changes
- SSL operations
- Service restarts
- Docker actions
- Warnings and errors with helpful context
The log is the fastest way to understand what Canopy just did.
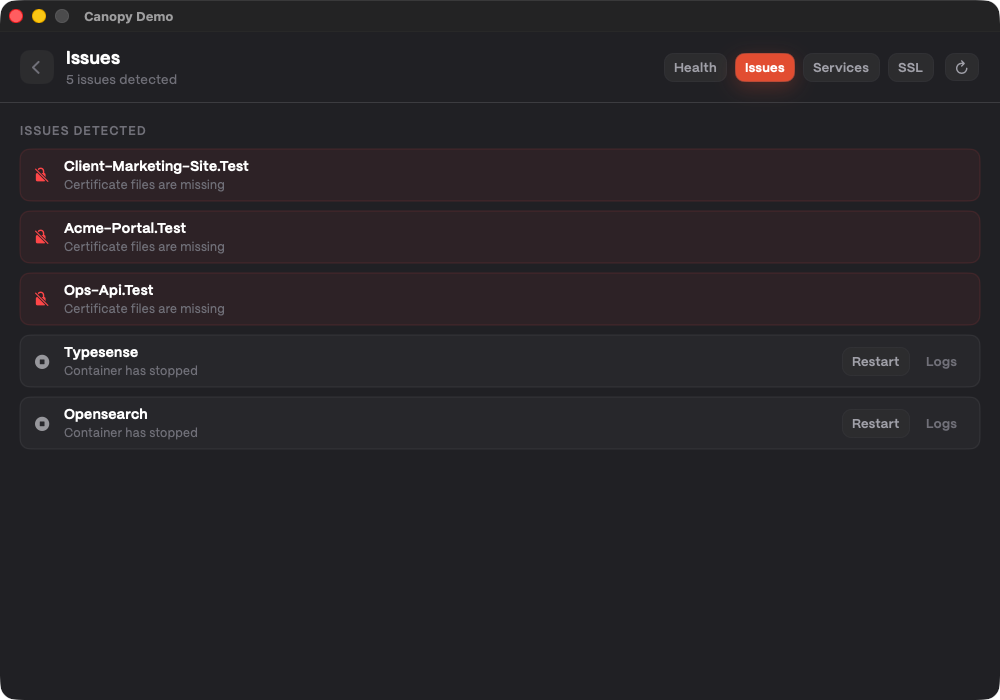 Temporary verification: Activity Log-style list with categorized entries and warning/error context.
Next up
Protect your data with Database Backups & Restore.