Services & Ports
Canopy runs a shared Docker stack so all your projects can use the same services.
Common services
- nginx (reverse proxy)
- PHP (8.1–8.5)
- Postgres and MySQL
- Redis
- MinIO
- Mailpit
- Search services (Typesense, Meilisearch, OpenSearch)
- RabbitMQ
- Grafana, Prometheus, Loki
- Qdrant
Start and stop services
Use the Services list to start, stop, or restart services. Canopy will only start what you need.
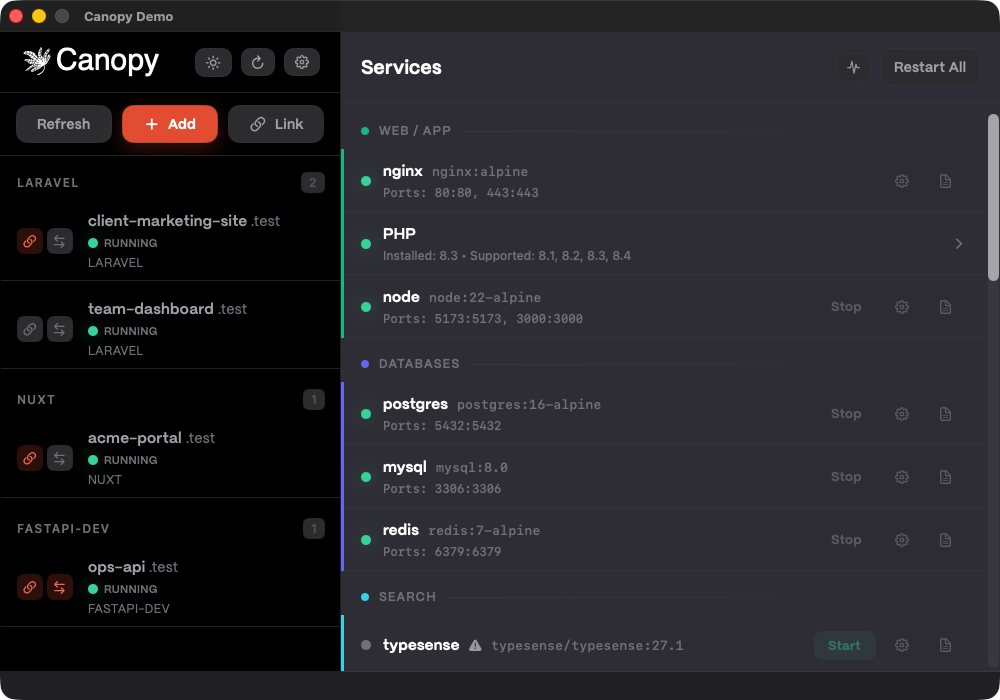
Connection info
Each service includes a connection info panel and can include things like host, port, user, password. Use these values in your app’s .env.
Example app .env values
Canopy syncs service hostnames into /etc/hosts, so you can use the same values whether your app runs inside Docker or directly on your Mac.
DB_HOST=postgres
DB_PORT=5432
REDIS_HOST=redis
REDIS_PORT=6379
MAIL_HOST=mailpit
MAIL_PORT=1025
This keeps local CLI workflows (for example, running Laravel artisan commands on your Mac) consistent with in-container app config. You would need to confirm that you're running the same version of PHP locally in this scenario, however.
If you changed ports in Service Settings, update the corresponding port values in your app config as needed.
PHP runtimes
Canopy ships versioned PHP-FPM services (php81–php85), with php83 as the default (also aliased as php). Choose a site's runtime when you create it (for example canopy add my-app app.test laravel --php-version 8.5) or switch it later in the app. If a site's configured runtime no longer satisfies its composer.json require.php constraint, the Health Dashboard flags a PHP Version Mismatch and recommends a compatible runtime.
Service proxies for web UIs
Canopy creates HTTPS proxy domains for service UIs (like https://mailpit.test or https://grafana.test). These are listed in each service’s connection info.
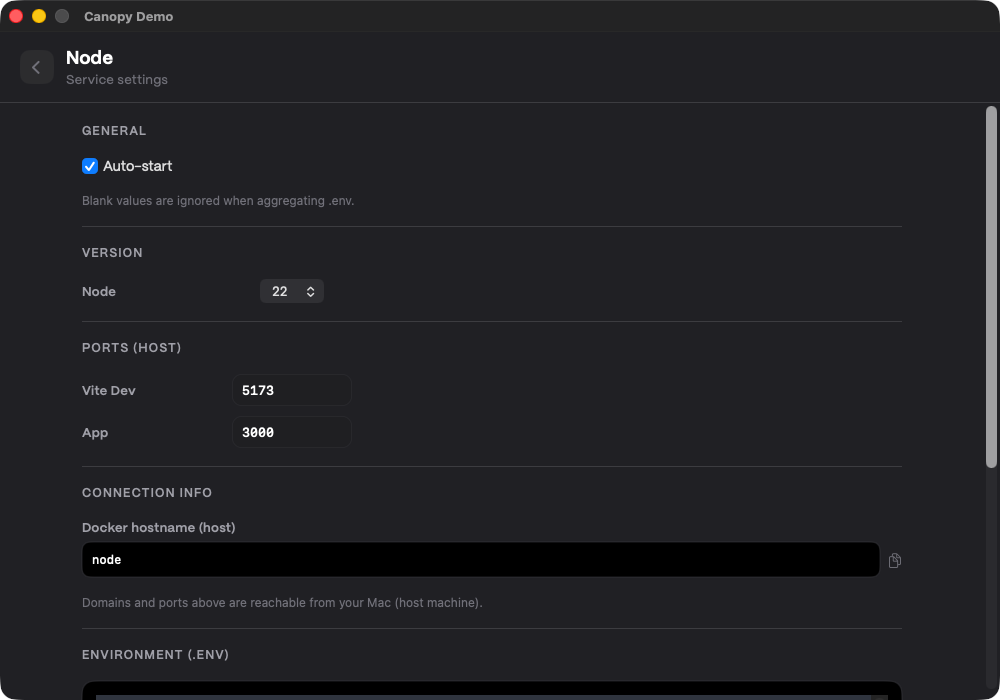
Change ports
If a port conflicts with another app:
- Open Service Settings.
- Change the port.
- Click Save & Restart to recreate the container with the new mapping.
The Node service uses port 3000 by default and can be customized, for example.
Quick restarts
- Restart Nginx & PHP:
Cmd+Return - Restart All Services:
Shift+Cmd+Return
Next up
Use the Health Dashboard & Activity Log to monitor your stack.